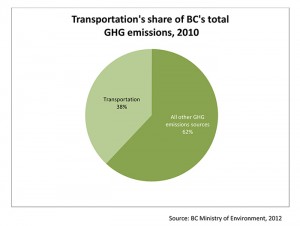
Transportation accounts for 40% of BC’s greenhouse gas emissions. This means we need to be rethinking our reliance on cars and trucks that burn fossil fuels. A central justice issue for transportation, which students understand well, is having access to a car. While electric vehicles are coming to the marketplace they are, at best, only part of the solution. Developing more complete communities – where people live closer to where they work, shop, access public services and play – is necessary if we want to see more walking, biking, public transit and car-sharing as alternative transportation modes.
This module draws on the Climate Justice Project report, Transportation Transformation: Building Complete Communities and a Zero-Emission Transportation System in BC.
OBJECTIVES
- Students will recognize how inequality affects access to transportation.
- Students will understand how urban and suburban design and infrastructure influences transportation choices and mobility.
- Students will explore low-carbon transportation alternatives, and ways in which we can change our systems and surroundings to make these alternatives more accessible.
COMPONENTS
- Connecting transportation to community design
- Considering transportation challenges and creating solutions
- Transforming transportation: A path to a better and more equitable BC
CURRICULUM CONNECTIONS
Science and Technology 11
Social Studies 8, 9, 10, 11; Civic Studies 11; Social Justice 12
English Language Arts 8, 9, 10, 11, 12; Communications 11, 12
Applied Skills 11; Business Education 10; Economics 12; Home Economics: Family Studies 10, 11, 12; Technology Education: Drafting and Design 11, 12; Technology Education: Industrial Design 11, 12
TOTAL SUGGESTED TIME: 1 hour 20 minutes
RESOURCES REQUIRED
- Digital projector and computer with internet access
- Whiteboard/chalkboard and markers/chalk
- Paper and pens/pencils
- PowerPoint slides: Transportation Transformation
 Part 1 – Connecting transportation to community design
READ ALOUD: In BC, 40% of the province’s greenhouse gas emissions come from transportation – cars and trucks that burn fossil fuels to move people and goods around.
 SHOW POWERPOINT SLIDE: “Transportation’s share of BC’s total GHG emissions” in the Transportation Transformation PowerPoint.
Today we are going to be looking at how transportation works and how it can be re-imagined for a zero-carbon province. When we think about transportation, we often think of cars, which is a great place to start.
BRAINSTORM AS A CLASS:
- What are the advantages of owning or having access to a car?
Possible responses: saves time; provides access to more activities or social opportunities; easier to do basic day-to-day things (e.g. errands); access to a wider range of job opportunities.
- What are the disadvantages of owning or having access to a car?
Possible responses: cost (gas, insurance, maintenance); parking in busy places; traffic congestion; greenhouse gas emissions.
QUESTIONS:
- Is having access to a car an advantage where we live? What is it about how our community is set up that makes owning a car an advantage? What about other communities? (Consider the differences in urban, suburban and rural communities.)
Possible responses: things are far away/spread out/non-centralized; people live far from where they work/play/access amenities and services; transportation systems (buses, trains, bicycle paths, etc.) may be underdeveloped or underfunded, so service is inadequate; getting around in rain, snow or cold conditions.
- Who has access to cars and their advantages, and who does not?
Possible responses: people who cannot afford to own a car; people who are unable to drive (e.g. youth, some people who are elderly or have disabilities).- Dilemma: Low-income households may need access to a car if they live far from work. Housing farther from the city core is often more affordable.
- What are some of the impacts of not having access to a car?
Possible responses: reduced access to work, services, or other amenities; exclusion from social activities; isolation; etc.
 Part 2 – Considering transportation challenges and creating solutions
BRAINSTORM AS A CLASS: What are some other transportation options or methods of low or zero carbon travel?
Record responses on the board. Students will probably come up with a list that looks like this (if they miss any, add them to the list):
- Bike/other person-powered transport, e.g. skateboard
- Walk
- Public transit (bus, train, etc.)
- Carpool
- Car share/co-op
- Hybrid or electric cars
ACTIVITY: Separate the class into small groups attached to each of the ideas generated above. Ask students to brainstorm and write down their thoughts on:
- What things might discourage people from utilizing this low carbon alternative? Be sure to include both personal and systemic factors.
- How could we change our cities or systems so people could more easily access this transportation option and more equitably reap the benefits?
Ask groups to report back to the class. Some elements to tease out during the debrief:
- Distance to work/play/amenities really affects a person’s carbon footprint and their ability to choose alternatives like walking, biking or transit. Positive solutions include:
- Providing people with a range of low or zero carbon options, including affordable, accessible and flexible public transit. People may choose differently depending on the weather, how rushed they are, whether they have items to transport, etc.
- Developing “complete communities” so more people live closer to where they work, play, shop and access public services. Complete communities reduce transportation costs and level the playing field for those who don’t drive their own car.
- Rethinking how we design communities, e.g. turning suburban malls into town centres, building new housing and commercial space instead of parking lots.
- Note: studies have shown that longer commute times negatively impact life satisfaction
- Physical systems matter:
- Improving public transit infrastructure and services (including affordability, accessibility, and frequency) would greatly encourage low carbon transportation use.
- Metro Vancouver is making a point of building high-density areas around Skytrain stations, creating community hubs around mass public transit.
- Having dedicated (safe) bike lanes greatly increases their use.
- Car sharing programs are a great option when other low carbon transportation alternatives are not realistic – many people will use these programs if the infrastructure is there to support them.
- Widespread internet access has made working from home a possibility for some people, which reduces their need to travel to and from work.
 Part 3 – Transforming transportation: A path to a better and more equitable BC
SHOW VIDEO: Transportation Transformation
READ ALOUD: Thoughts to travel with:
- Improving public transportation, bike paths, density and community design will improve mobility and lower costs for all British Columbians.
- It is essential that we reduce our GHG emissions and redesign our cities for the realities of climate change.
- Building public transit lines and transportation infrastructure, and designing spaces for density and accessibility, require labour and vision and will create good paying jobs.
“A zero emissions transportation system by 2040 is both desirable and achievable.”
– CJP report, Transportation Transformation: Building Complete Communities and a Zero-Emission Transportation System in BC
PAIR-SHARE: What are some things we can do to make low carbon transportation options more accessible for our school and community, and move towards creating a more complete community?
Questions and activities for further exploration
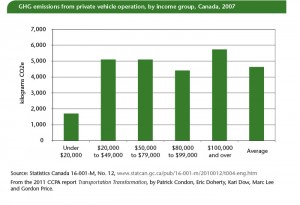
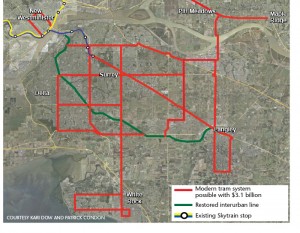
- Choose one of the graphs or charts listed below (located in the PowerPoint slides for this module). Write about the implications of this information in the graph/chart. What changes to policy would you recommend based on this information?
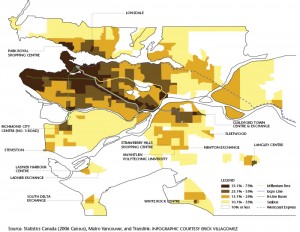
- Getting to Work In Metro Vancouver: Commuting by Transit, Walking and Biking, 2006
- GHG Emissions from Private Vehicle Operation, by Income Group, 2007
- Port Mann Bridge vs. light rail transit infrastructure
- Visit Mapnificent [Lower mainland only as of July 2014]. Mapnificient is a website that shows you the areas than can be reached from any given destination, using public transit, in any given time. Move the flag to different parts of the lower mainland and notice how your mobility by public transit changes. How is access to amenities, work and cultural centres affected by geography? How is this tied to socio-economic status?
- Using artwork and images, show how you would redesign your community for smarter, fairer, low-carbon transportation.
- Create a video blog or map outlining or highlighting the low carbon transportation alternatives and infrastructure in your community (e.g. where are bike lanes, bus routes? Are there well-marked walking routes or crossing guards? Are there great walking routes that everyone should know about?).
- Call your municipal or regional government office and find out about the transportation development plan in your community over the next few years.


